 Written byAurélien RUMIANO
Einführung
Finally, I was able to make a 3d model of my nasal cavity usable with a CFD software.
For those who don’t know what is CFD, it just mean Computational Fluid Dynamics which is the study of fluids, in our case the air.
I took 15 l/min for the flow rate and I did not apply temperature conditions on the walls.
Just for information each nostril has a surface of around 68 mm² and the beguining of my pharynx 420 mm². And you can see my cross-sectional area here, in my precedent article.
Ergebnisse

In dieser Ansicht wird der Luftstrom durch winzige Röhren dargestellt. Wir sehen, dass fast der gesamte Luftstrom mit einer Geschwindigkeit zwischen 1,5 und 2 m/s durch den mittleren Nasengang strömt. Im Gegensatz dazu gibt es im Bereich des unteren Nasengangs fast keinen Luftstrom und die Geschwindigkeit ist sehr niedrig, weniger als 0,5 m/s. In der Nähe der Nasenlöcher ist die Geschwindigkeit in einigen Bereichen mit etwa 3 m/s ziemlich hoch.

Dasselbe gilt für die linke Seite.
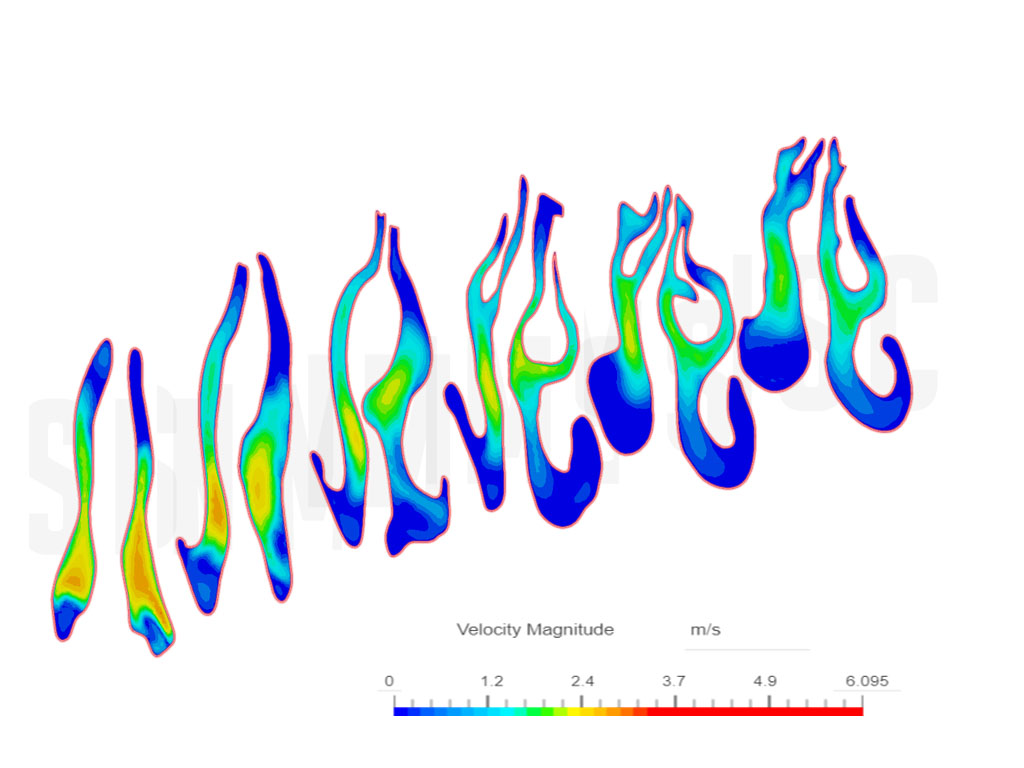
In dieser Ansicht ist die Nasenhöhle geschnitten. Links in der Abbildung befindet sich der Bereich nahe dem Nasenloch, rechts der Bereich nahe dem Rachen. Wir sehen nur die Geschwindigkeit, nicht die Menge des Luftstroms, und erkennen dasselbe wie in den anderen Ansichten: eine sehr niedrige Geschwindigkeit im unteren Nasengang trotz meines Implantats an der rechten Nasenwand.
Interpretation der Ergebnisse
The results are not very surprising, some studies come to the same conclusion about the airflow distribution. In this study for instance they showed the same thing, an important reduction of the airflow in the inferior meatus (25.8% ± 17.6%) . They also showed a reduction in wall shear stress (WSS) in the inferior meatus area, which is the force of friction on the walls of the mucosa. Less shear stress means less airflow sensation. And I’m not sure but less airflow quantity and less velocity mean less wall shear stress. In my simulation, I was not able to measure the wall shear stress due to software limitations but since the velocity and the airflow are very low in the inferior meatus then we can say that the WSS too. And according to this same study, the symptoms “of “suffocation” and “nose feels too open” were also found to be significantly correlated with peak WSS around the inferior turbinate. So in others words less WSS in the inferior meatus zone mean more symptoms of suffocation and the feeling of the nose too open.

Fazit und nächster Schritt
Da wir nun deutlich sehen, dass eines der Probleme bei ENS die Luftstromverteilung ist, werde ich versuchen, dies mit einigen virtuellen Implantaten zu beheben, die in verschiedenen Bereichen platziert werden. Das Ziel ist natürlich, eine Luftstromverteilung wie bei einer gesunden Nase zu erreichen.
Einschränkungen
Just to be clear, I’m not a reasearcher nor a CFD specialist, so the results can be wrong due to many things. If you see an error in the conditions or the reasoning, please can contact me.