 Written byAurélien RUMIANO
Wprowadzenie
Finally, I was able to make a 3d model of my nasal cavity usable with a CFD software.
For those who don’t know what is CFD, it just mean Computational Fluid Dynamics which is the study of fluids, in our case the air.
I took 15 l/min for the flow rate and I did not apply temperature conditions on the walls.
Just for information each nostril has a surface of around 68 mm² and the beguining of my pharynx 420 mm². And you can see my cross-sectional area here, in my precedent article.
Wyniki

W tym widoku przepływ powietrza przedstawiono za pomocą cienkich rurek. Widzimy, że niemal cały przepływ przechodzi przez przewód nosowy środkowy z prędkością od 1,5 do 2 m/s. Natomiast w obszarze przewodu nosowego dolnego przepływ powietrza jest niemal zerowy, a prędkość bardzo niska — poniżej 0,5 m/s. W pobliżu nozdrzy w niektórych obszarach prędkość jest dość wysoka i wynosi około 3 m/s.

To samo dotyczy lewej strony.
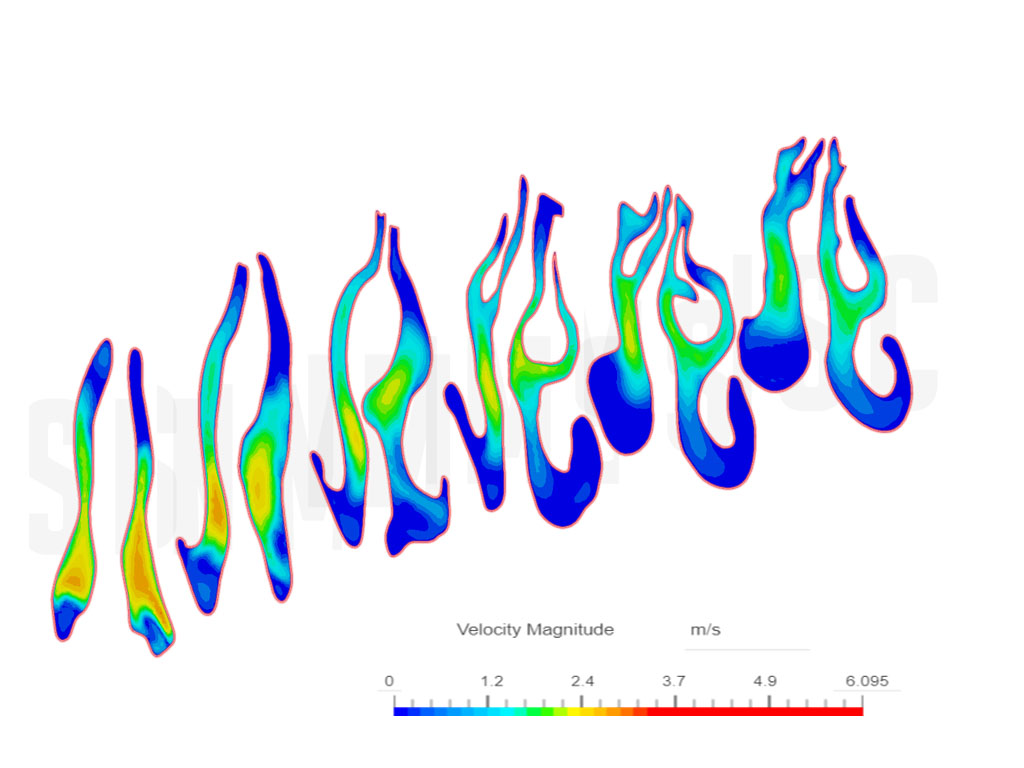
W tym widoku jama nosowa jest pokazana w przekroju: po lewej stronie ilustracji znajduje się obszar w pobliżu nozdrza, a po prawej — w pobliżu gardzieli. Widzimy tylko prędkość, a nie ilość przepływającego powietrza, i obserwujemy to samo co w innych widokach: bardzo niską prędkość w przewodzie nosowym dolnym, mimo implantu w prawej ścianie nosa.
Interpretacja wyników
The results are not very surprising, some studies come to the same conclusion about the airflow distribution. In this study for instance they showed the same thing, an important reduction of the airflow in the inferior meatus (25.8% ± 17.6%) . They also showed a reduction in wall shear stress (WSS) in the inferior meatus area, which is the force of friction on the walls of the mucosa. Less shear stress means less airflow sensation. And I’m not sure but less airflow quantity and less velocity mean less wall shear stress. In my simulation, I was not able to measure the wall shear stress due to software limitations but since the velocity and the airflow are very low in the inferior meatus then we can say that the WSS too. And according to this same study, the symptoms “of “suffocation” and “nose feels too open” were also found to be significantly correlated with peak WSS around the inferior turbinate. So in others words less WSS in the inferior meatus zone mean more symptoms of suffocation and the feeling of the nose too open.

Wnioski i następny krok
Teraz, gdy wyraźnie widzimy, że jednym z problemów związanych z ENS jest rozkład przepływu powietrza, spróbuję go poprawić za pomocą wirtualnych implantów umieszczonych w różnych obszarach. Celem jest oczywiście zbliżenie się do rozkładu przepływu powietrza występującego w zdrowym nosie.
Ograniczenia
Just to be clear, I’m not a reasearcher nor a CFD specialist, so the results can be wrong due to many things. If you see an error in the conditions or the reasoning, please can contact me.