Introduction
Finally, I was able to make a 3d model of my nasal cavity usable with a CFD software.
For those who don't know what is CFD, it just mean Computational Fluid Dynamics which is the study of fluids, in our case the air.
I took 15 l/min for the flow rate and I did not apply temperature conditions on the walls.
Just for information each nostril has a surface of around 68 mm² and the beguining of my pharynx 420 mm². And you can see my cross-sectional area here, in my precedent article.
Results

In this view, the airflow is represented by tiny tubes. We can see that almost all the airflow passes through the middle meatus at a velocity between 1,5 and 2 m/s. On the opposite in the inferior meatus zone, there is almost no airflow and the velocity is very low, less than 0,5 m/s. Near the nostrils, in some areas, the velocity is pretty high around 3 m/s.

Same thing for the left side.
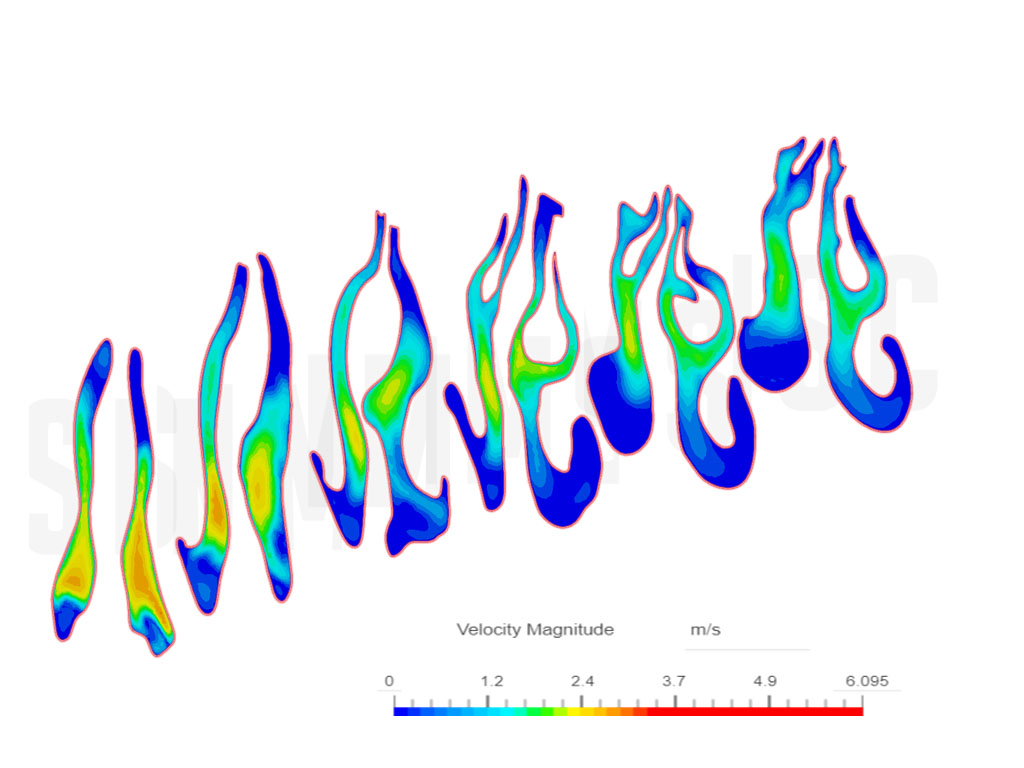
In this view, the nasal cavity is sliced, at the left of the illustration it is near the nostril, and at the right near the pharynx. We just see the velocity not the quantity of airflow, and we can see the same thing that in the other views, very low velocity in the inferior meatus despite my right nasal wall implant.
Results interpretation
The results are not very surprising, some studies come to the same conclusion about the airflow distribution. In this study for instance they showed the same thing, an important reduction of the airflow in the inferior meatus (25.8% ± 17.6%) . They also showed a reduction in wall shear stress (WSS) in the inferior meatus area, which is the force of friction on the walls of the mucosa. Less shear stress means less airflow sensation. And I'm not sure but less airflow quantity and less velocity mean less wall shear stress. In my simulation, I was not able to measure the wall shear stress due to software limitations but since the velocity and the airflow are very low in the inferior meatus then we can say that the WSS too. And according to this same study, the symptoms "of "suffocation" and "nose feels too open" were also found to be significantly correlated with peak WSS around the inferior turbinate. So in others words less WSS in the inferior meatus zone mean more symptoms of suffocation and the feeling of the nose too open.

Conclusion and next step
Now that we clearly see that one of the problem in ENS is the airflow distribution, I will try to fix that with some virtual implants placed in differents area. The goal of course is to tend towards the same airflow distribution of a heathy nose.
Limitations
Just to be clear, I'm not a reasearcher nor a CFD specialist, so the results can be wrong due to many things. If you see an error in the conditions or the reasoning, please can contact me.