
Fluid simulation
Introduction
Author: Aurélien RUMIANO
Patient: Walter Menez
Parameters of the study
Flow used for the fluid study 15l/min.
Inspiration phase.
Humidity and temperature are not taken into account.
🛑Disclaimer: I am neither a fluid mechanics researcher nor a doctor. The results I obtain using my fluid simulation software may be approximate. The purpose of these fluid simulations is to give you an idea of the air flow and possible problems related to it.
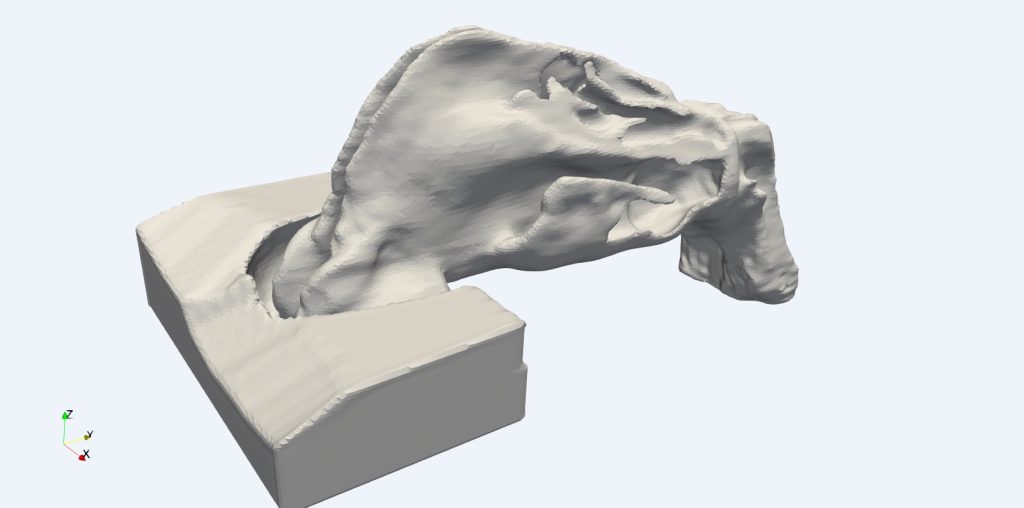
The illustration below represents the nasal cavity, the anterior part in red, the middle meatus in green and finally the inferior meatus in blue.
The following illustration represents the negative of the nasal cavity, that is to say the air which is inside the nasal cavity. All illustrations that follow will be represented in this manner.
The block that sticks the nostrils simply represents the air around it.

CT-SCAN
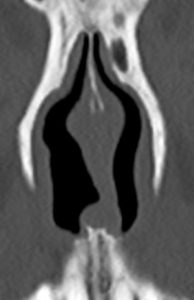
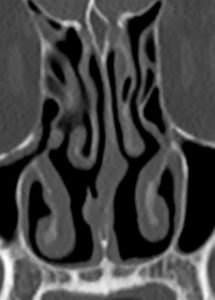
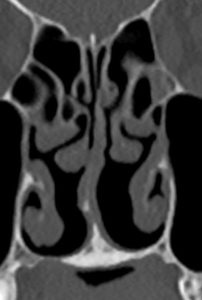
On the right (left side on the scanner) the anterior part is very open due it seems to a deviation of the septum and its thinness.
Further in the nasal cavity it is the opposite, the left side is emptier, indeed the left turbinate has been reduced in volume.
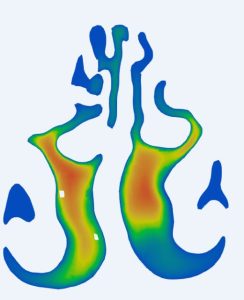
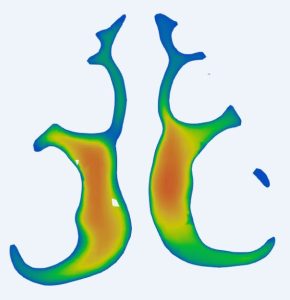
Airflow velocity
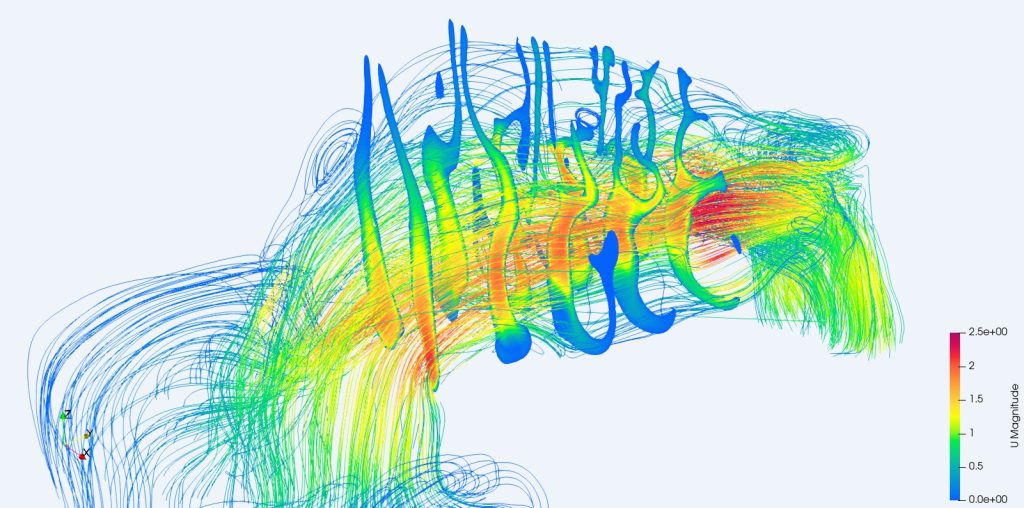
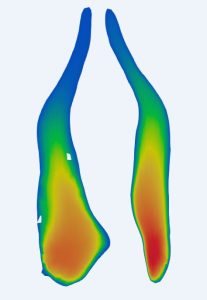
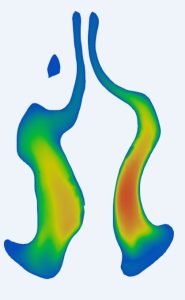
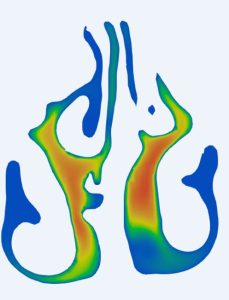

Description & analysis
The current lines represent the air flow, the speed scale goes from 0 to 2.5 m/s.
Speeds above 2.5 m/s are shown in red.
We can see that the airflow is concentrated in the middle meatus, which is typical of ENS, especially on the left side.
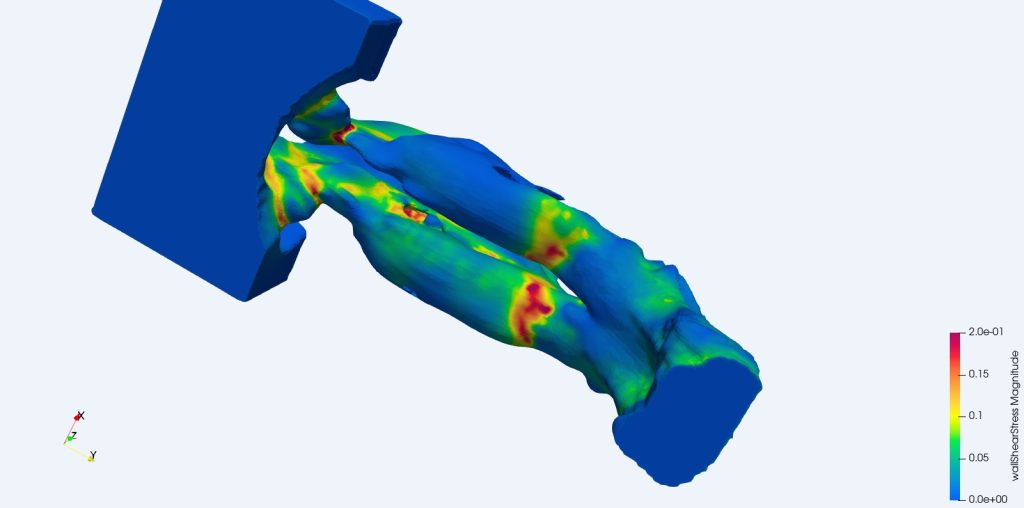
Wall Sheer Stress
Description
The areas colored red represent areas where the WSS is greater than 0.2 Pa. That is to say, these are the areas where the air rubs the most against the mucosa and therefore creates the most air sensation.
We can see that the areas where the WSS is the highest are mainly the anterior part. This is a normal phenomenon because this is where the section is the smallest.
The WSS is low at the floor of the nasal cavity due to the lack of volume of the inferior turbinates, especially at left side.
Airflow imbalance
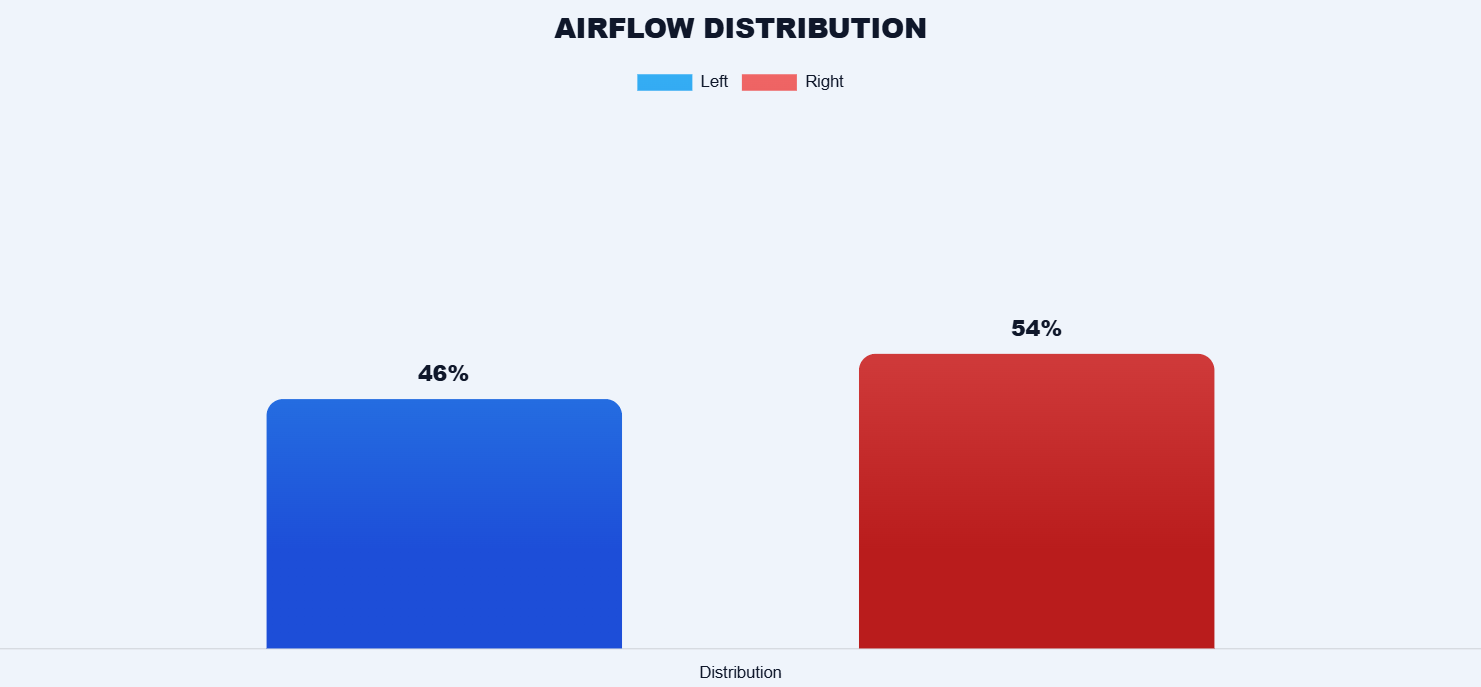
54% of the airflow passes through the right side and therefore 46% on the left.
So the airflow is well balanced between the two sides despite the large opening at the right side in the anterior part.
Nasal resistance
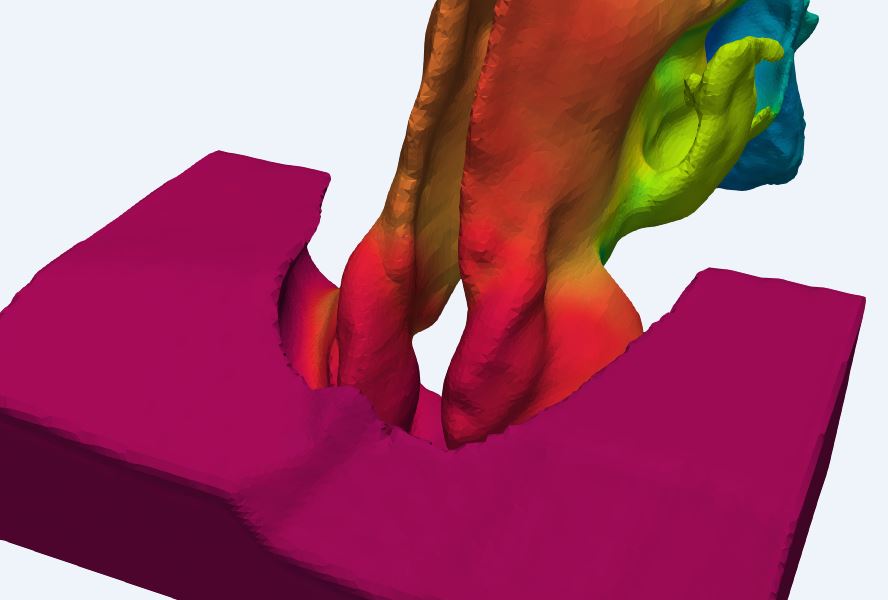
Description and analysis
The total resistance is around 5 Pa which is quite low. This is due to the lack of volume. According to my little experience in fluid simulation, values between 10 and 20 Pa are normal.
Cross sectiona area
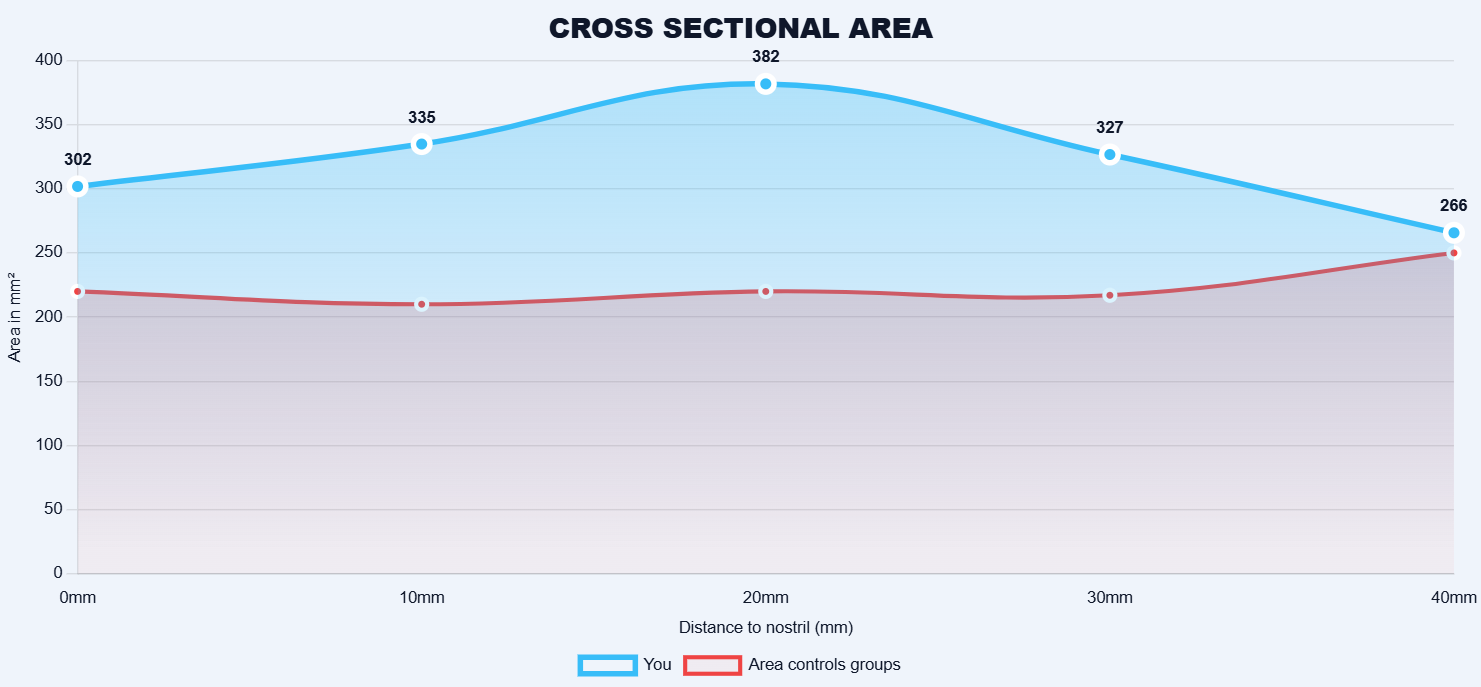
The cross-sectional area peak at around 330 mm² from 20 mm to nostrils. Which is a bit high.
The data of the control group are pulled from a study, but I have seen some non ENS case at around 300mm². So I think that between 200 and 300 mm² the values can be considered normal.
Conclusion
I see two problems.
On the right the nasal cavity is too open in the anterior part, on the left it is too open in the middle of the nasal cavity.
This results in low nasal resistance, low WSS and an airflow concentrated mainly in the middle meatus.
Therefore, I think it would be necessary to add volume on the right in the anterior part and on the left in the lower part opposite the turbinate. I think then that two implants in the septum could be a good solution.
| Situation | Nasal resistance (Pa) | Mean cross-sectional area (mm²) | Pharynx size (mm²) |
|---|---|---|---|
| Actual | 5 | 322 | 316 |
| After virtual implants |