I run an airflow simulation (CFD) of your own nasal cavity, from your CT scan, and I write you a report: where the air goes, how fast, how much it rubs on the mucosa and how it warms up.
You fill out a form and share your CT scan. I do the rest.
 Gauges, cut views and a 3D you can rotate.Open the report →


The airflow shown as lines coloured by velocity, plus cut views taken at several levels of the nasal cavity.

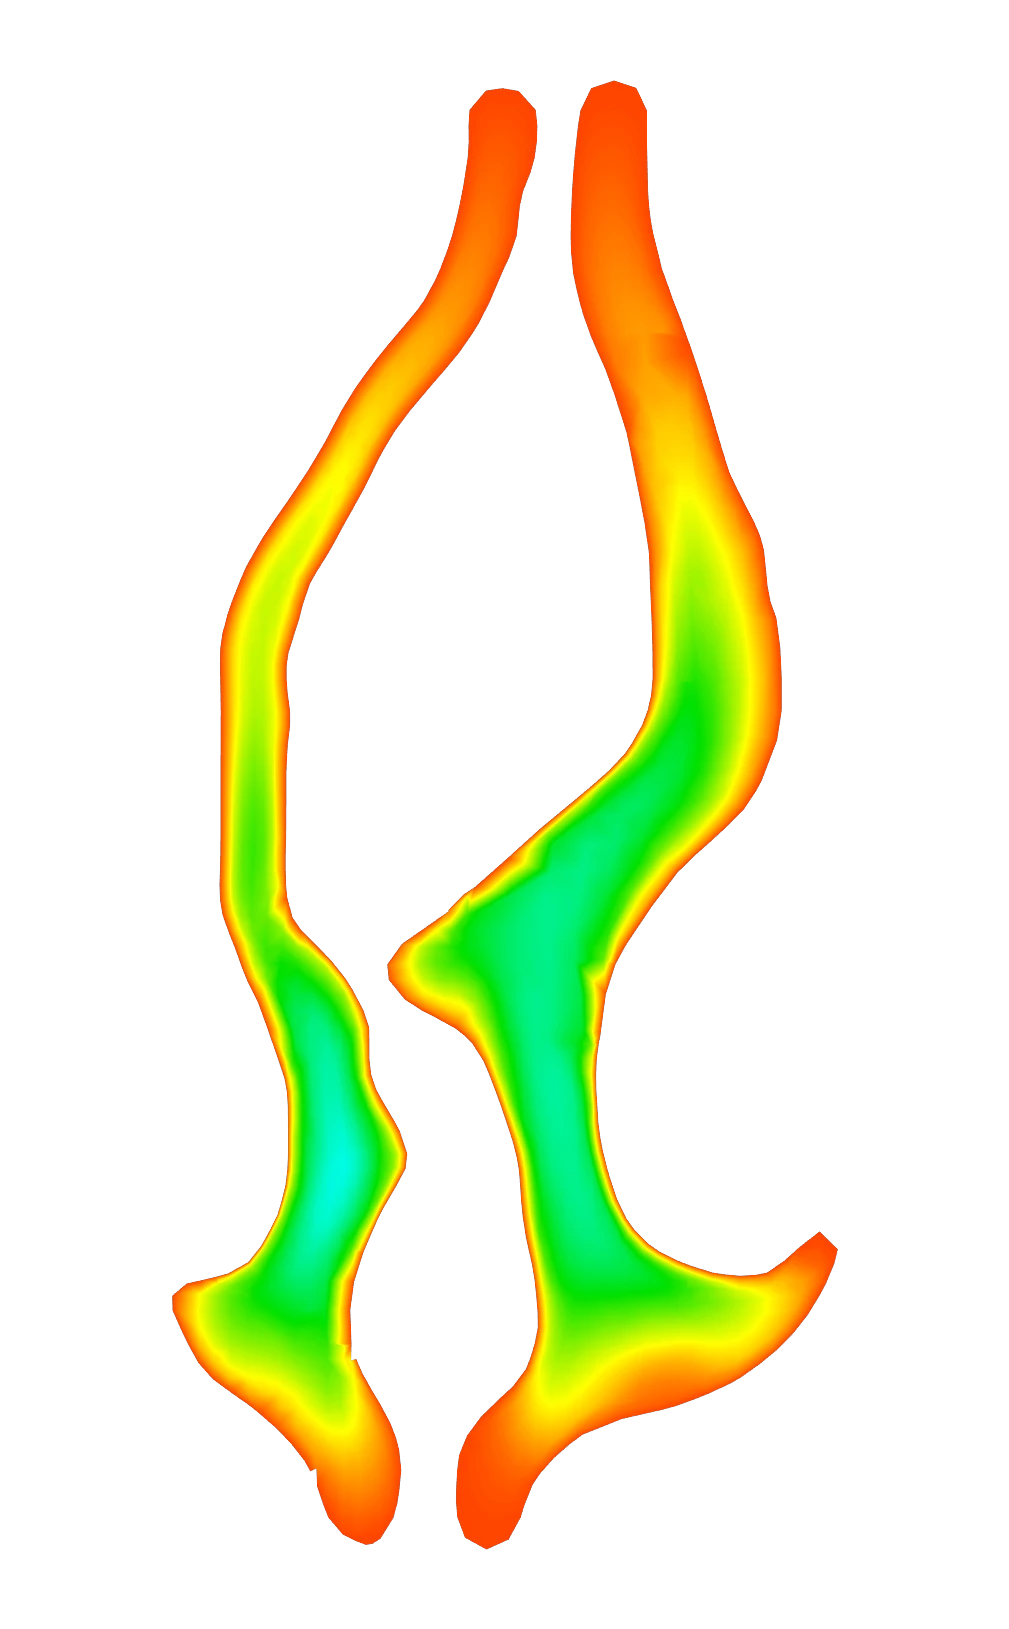
The pressure exerted by the airflow on the walls. The higher the velocity gradient near the wall, the higher the WSS and it is the WSS that takes part in the airflow sensation.
How the inhaled air is warmed up along the nasal cavity, mapped in 3D and on cut views.
| Data | Sample | Reference |
|---|---|---|
| Nasal resistance | 6.2 Pa | 7 to 17 Pa |
| Mean cross-sectional area | 347 mm² | 200 to 300 mm² |
| Mean mucosa perimeter | 305 mm | |
| Mean velocity | 0.81 m/s | |
| Mean Wall Shear Stress | 0.047 Pa | |
| Air temperature at 40 mm | 32.1 °C | |
| Pharynx size | 196 mm² |
Every report ends with a table of figures. The nasal resistance and the cross-sectional area are compared with values taken from published studies.
With a virtual surgery, a second line shows the same figures after the modification.
A presentation of the simulation report.

The pressure exerted by the airflow on the walls. The higher the velocity gradient near the wall, the higher the WSS and it is the WSS that takes part in the airflow sensation.

The airflow shown as lines coloured by velocity, plus cut views taken at several levels of the nasal cavity.

How the inhaled air is warmed up along the nasal cavity, mapped in 3D and on cut views.

The pressure drop between the nostrils and the choanae. This is the resistance your nose opposes to the airflow.

How the airflow splits between the right and the left side, as a percentage.

The average area of the “emptiness” inside the nasal cavity.

The average mucosa perimeter, calculated over 5 sections. It represents the amount of mucosa.

The average speed of the air going through the nasal cavity.

How much the inhaled air has already been warmed up 40 mm after the nostrils.

The average Wall Shear Stress, calculated over 3 sections. It reflects how much friction there is between the air and the mucosa.

The cross-sectional area of the pharynx at its narrowest point. A value that is too low indicates a risk of obstructive sleep apnea.
Fill out the request form.
In DICOM format, with the folder compressed into a .zip or .rar file. The video shows how to do it.
Simulation, data extraction and report writing: about 6 hours of work.
In about 3 days, with all the views and figures listed above, like the sample report.
Tutorial. How to compress your DICOM folder and share it.
In addition to the fluid simulation service, I can perform virtual surgeries on your nasal cavity to simulate implants, for example. Here is the procedure:
I am performing an initial fluid simulation based on your scan to establish a baseline for comparison.

I discuss with you the placement and size of the virtual implants or any other structural modifications to your nasal cavity. Then, I adjust the 3D model accordingly.

Finally, I perform a new fluid simulation to compare the results with the initial one. I provide you with a comprehensive report that includes the before-and-after results of your nasal cavity modifications.

Your CT scan in DICOM format. It allows an accurate 3D reconstruction of your nasal cavity.
The airflow simulation costs 120 €, and I deliver the report in about 3 days. A virtual surgery costs 120 € more, on top of the simulation.
I deliver the report in about 3 days.
The pressure exerted by the airflow on the nasal walls. It is a key value to understand the sensation of airflow in Empty Nose Syndrome.
A flow of 15 l/min, during inspiration, with a mucosa at 34 °C.
No. I am neither a fluid mechanics researcher nor a doctor, and the results may be approximate. The purpose of the simulation is to give you an idea of the airflow and of the possible problems related to it.
The price is determined by the time I need to perform the simulation, extract the data and write the report.
