Fluid simulation
Introduction
Author: Aurélien RUMIANO
Patient: Rabbit
Parameters of the study
Flow used for the fluid study 0.68l/min.
Inspiration phase.
Humidity and temperature are not taken into account.
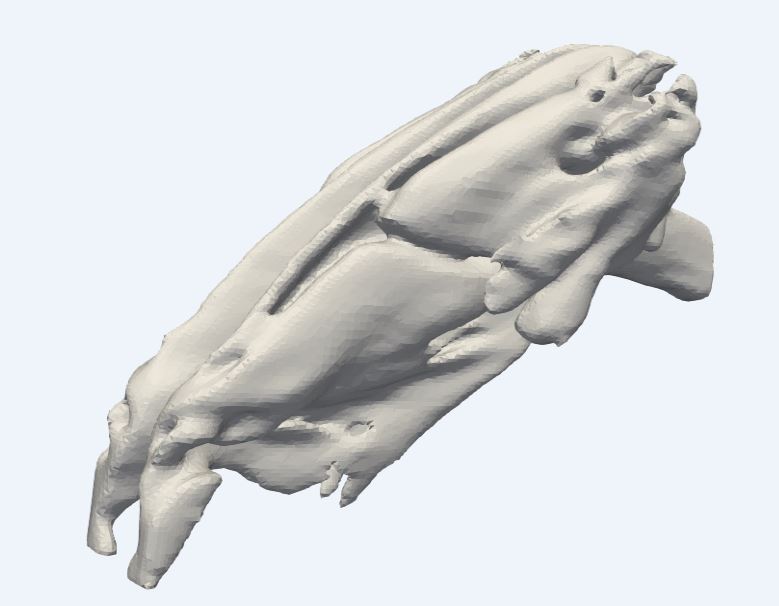
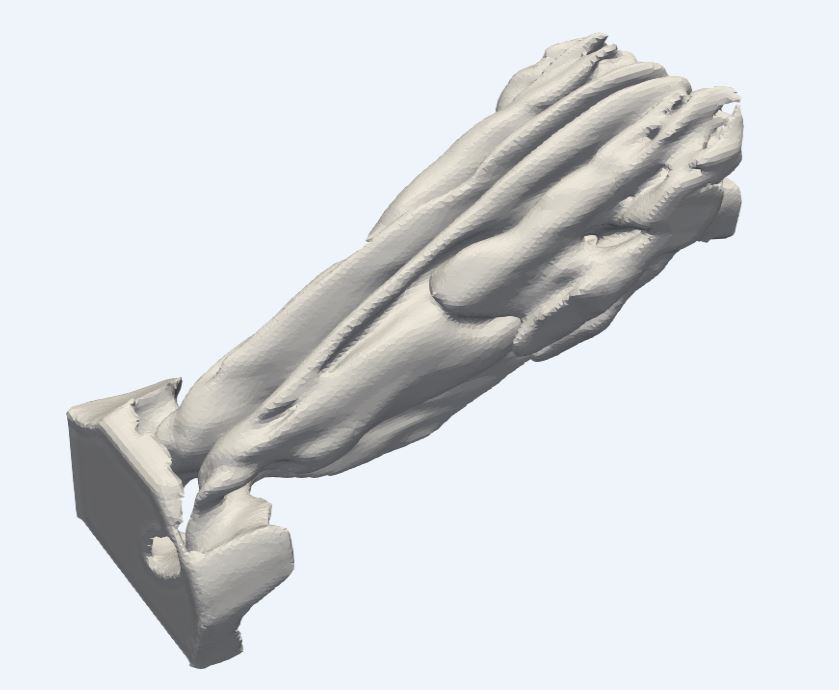
I kept the volume of air around the nostrils so as not to cut off the nostril inlet and distort the CFD results.
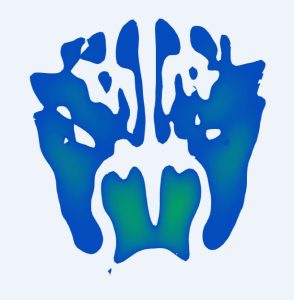
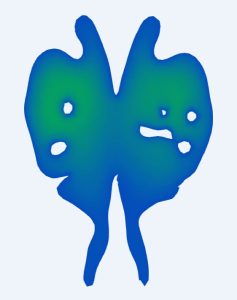
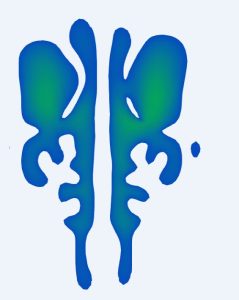
CT-SCAN
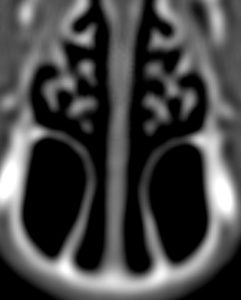
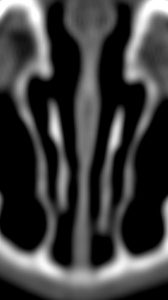
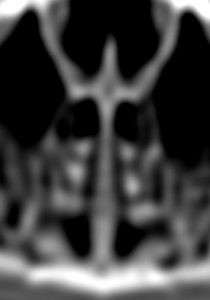
3 cuts pulled from the ct-scan, as you can see they are very blurry.
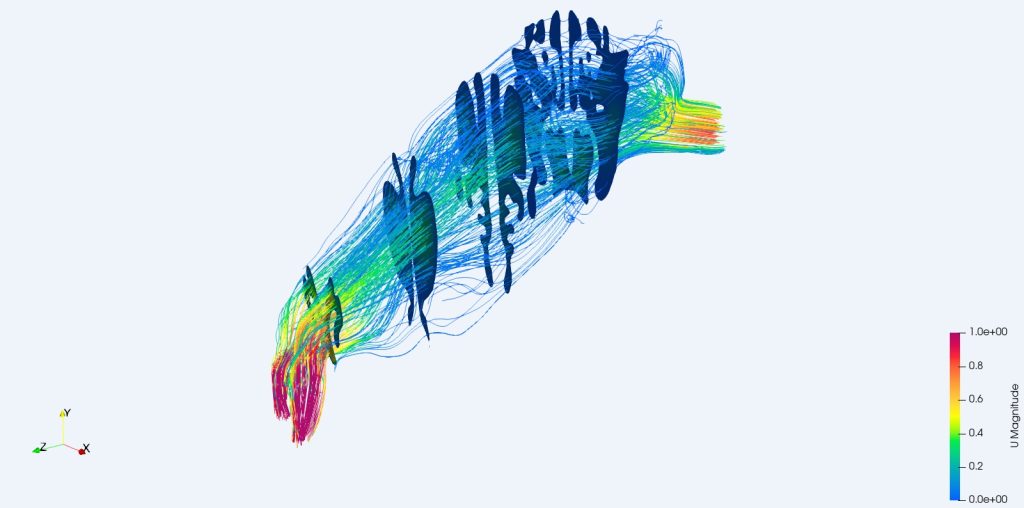
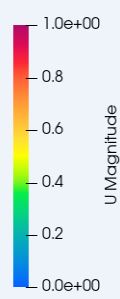
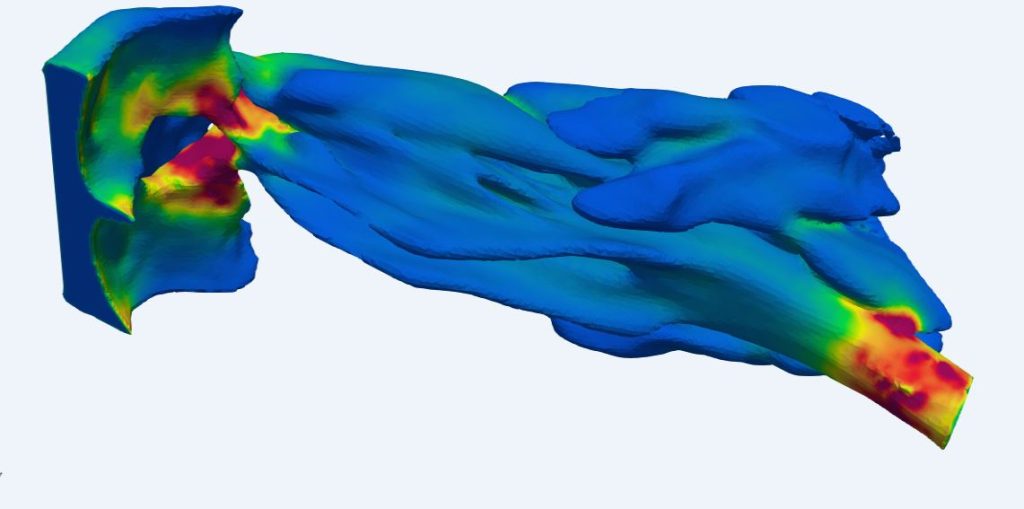
Airflow velocity

Airflow velocity after treatment

Description & analysis
The current lines represent the air flow, the speed scale goes from 0 to 1 m/s.
Speeds above 1 m/s are shown in red.
I needed to change the scale from max 2.5 m/s for human to max 1 m/s for rabbit.
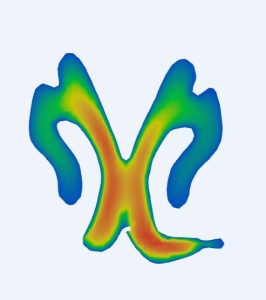
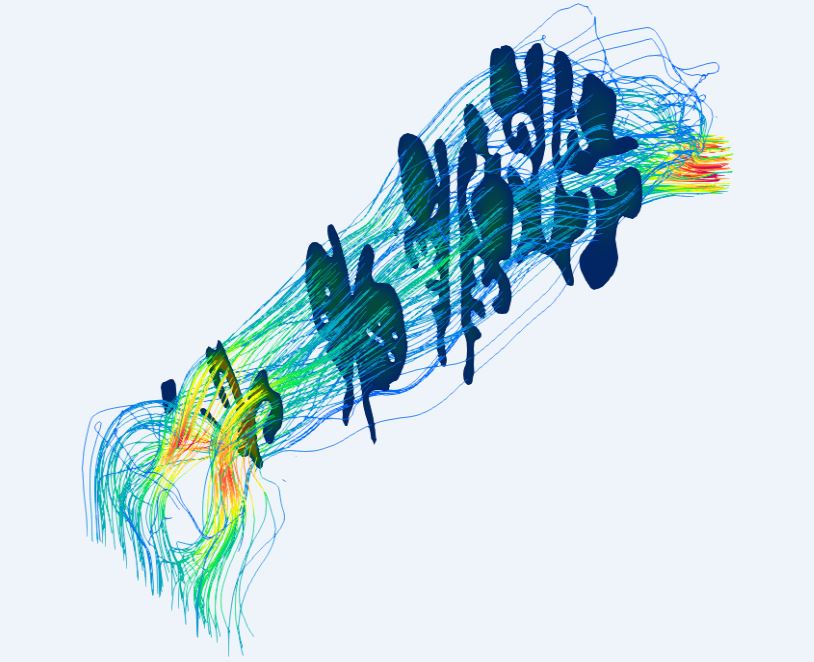
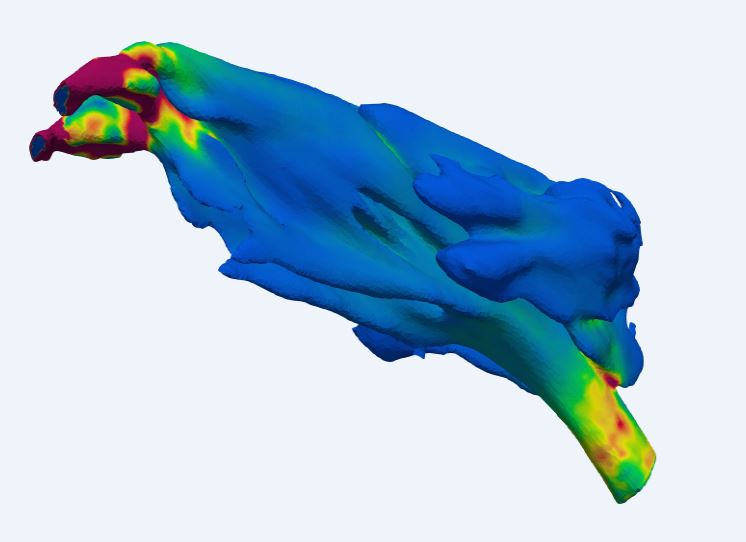
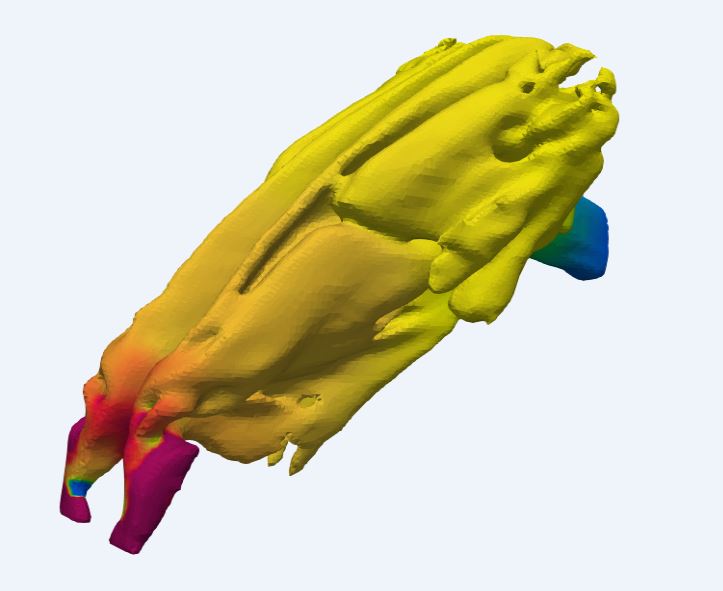
Wall Sheer Stress before
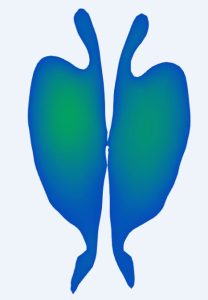
Wall Shear Stress after treatment
Description
The areas colored red represent areas where the WSS is greater than 0.05 Pa. That is to say, these are the areas where the air rubs the most against the mucosa and therefore creates the most air sensation.
Airflow imbalance
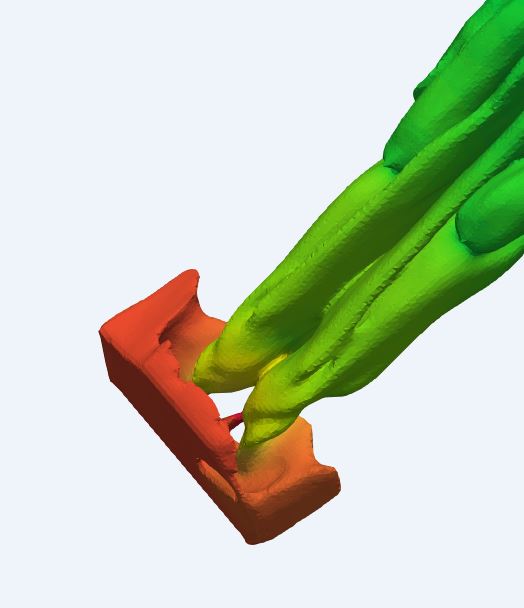
Nasal resistance
Description and analysis
The total resistance is around 3.1 Pa and 1.5 Pa after treatment
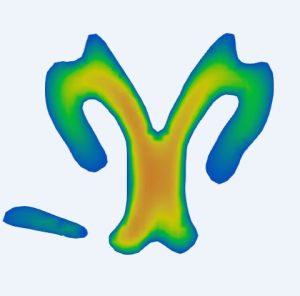
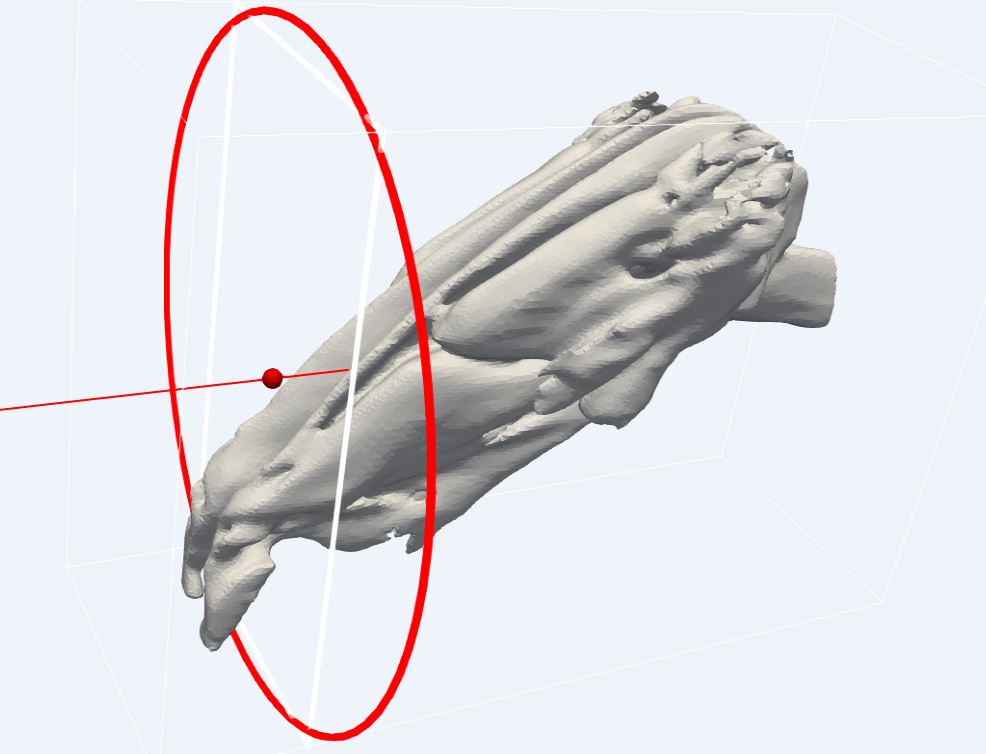
Cross sectiona area
Comments
The nasal resistance value is lower in the post-treatment analysis because the 3D model is different.
I took air from around the nostrils so as not to cut them off and thus increase accuracy.
As can be seen in the cross-sections, due to the poor quality of the scanner, more air volume was modeled. This can be seen in the 0 and 10 mm cross-sections, which look as if there were a hole in the nasal septum.
This also influenced the results.
I think it will be difficult to find a significant difference in volume before and after treatment. Stem cells do not add much volume.
Even if a little volume has been added, it may not be visible in the CFD because it will be within the margin of error of the 3D reconstruction.
| Situation | Mean cross-sectional area (mm²) | Mean mucosa perimeter (mm) | Mean WSS (Pa) | Pharynx size (mm²) |
|---|---|---|---|---|
| Actual | 0 | 0 | 0 | 0 |
| After virtual implants |